Every rod pump training course starts the same way: here is an ideal pump card, it is a rectangle, now here are eight shapes that are not rectangles. Memorize them.
That approach produces engineers who can match a textbook pattern to a textbook card. It does not produce engineers who can diagnose what is actually happening at 7,500 ft in a deviated well with 30% gas, a worn barrel, and a traveling valve that started leaking two weeks ago - all showing up on the same card simultaneously.
This article is different. We are going to work through dynamometer card interpretation the way it actually happens in the field - where cards are messy, conditions overlap, and the surface card rarely tells you the whole story without doing the math.
The Physics You Already Know (and the Part Most People Get Wrong)
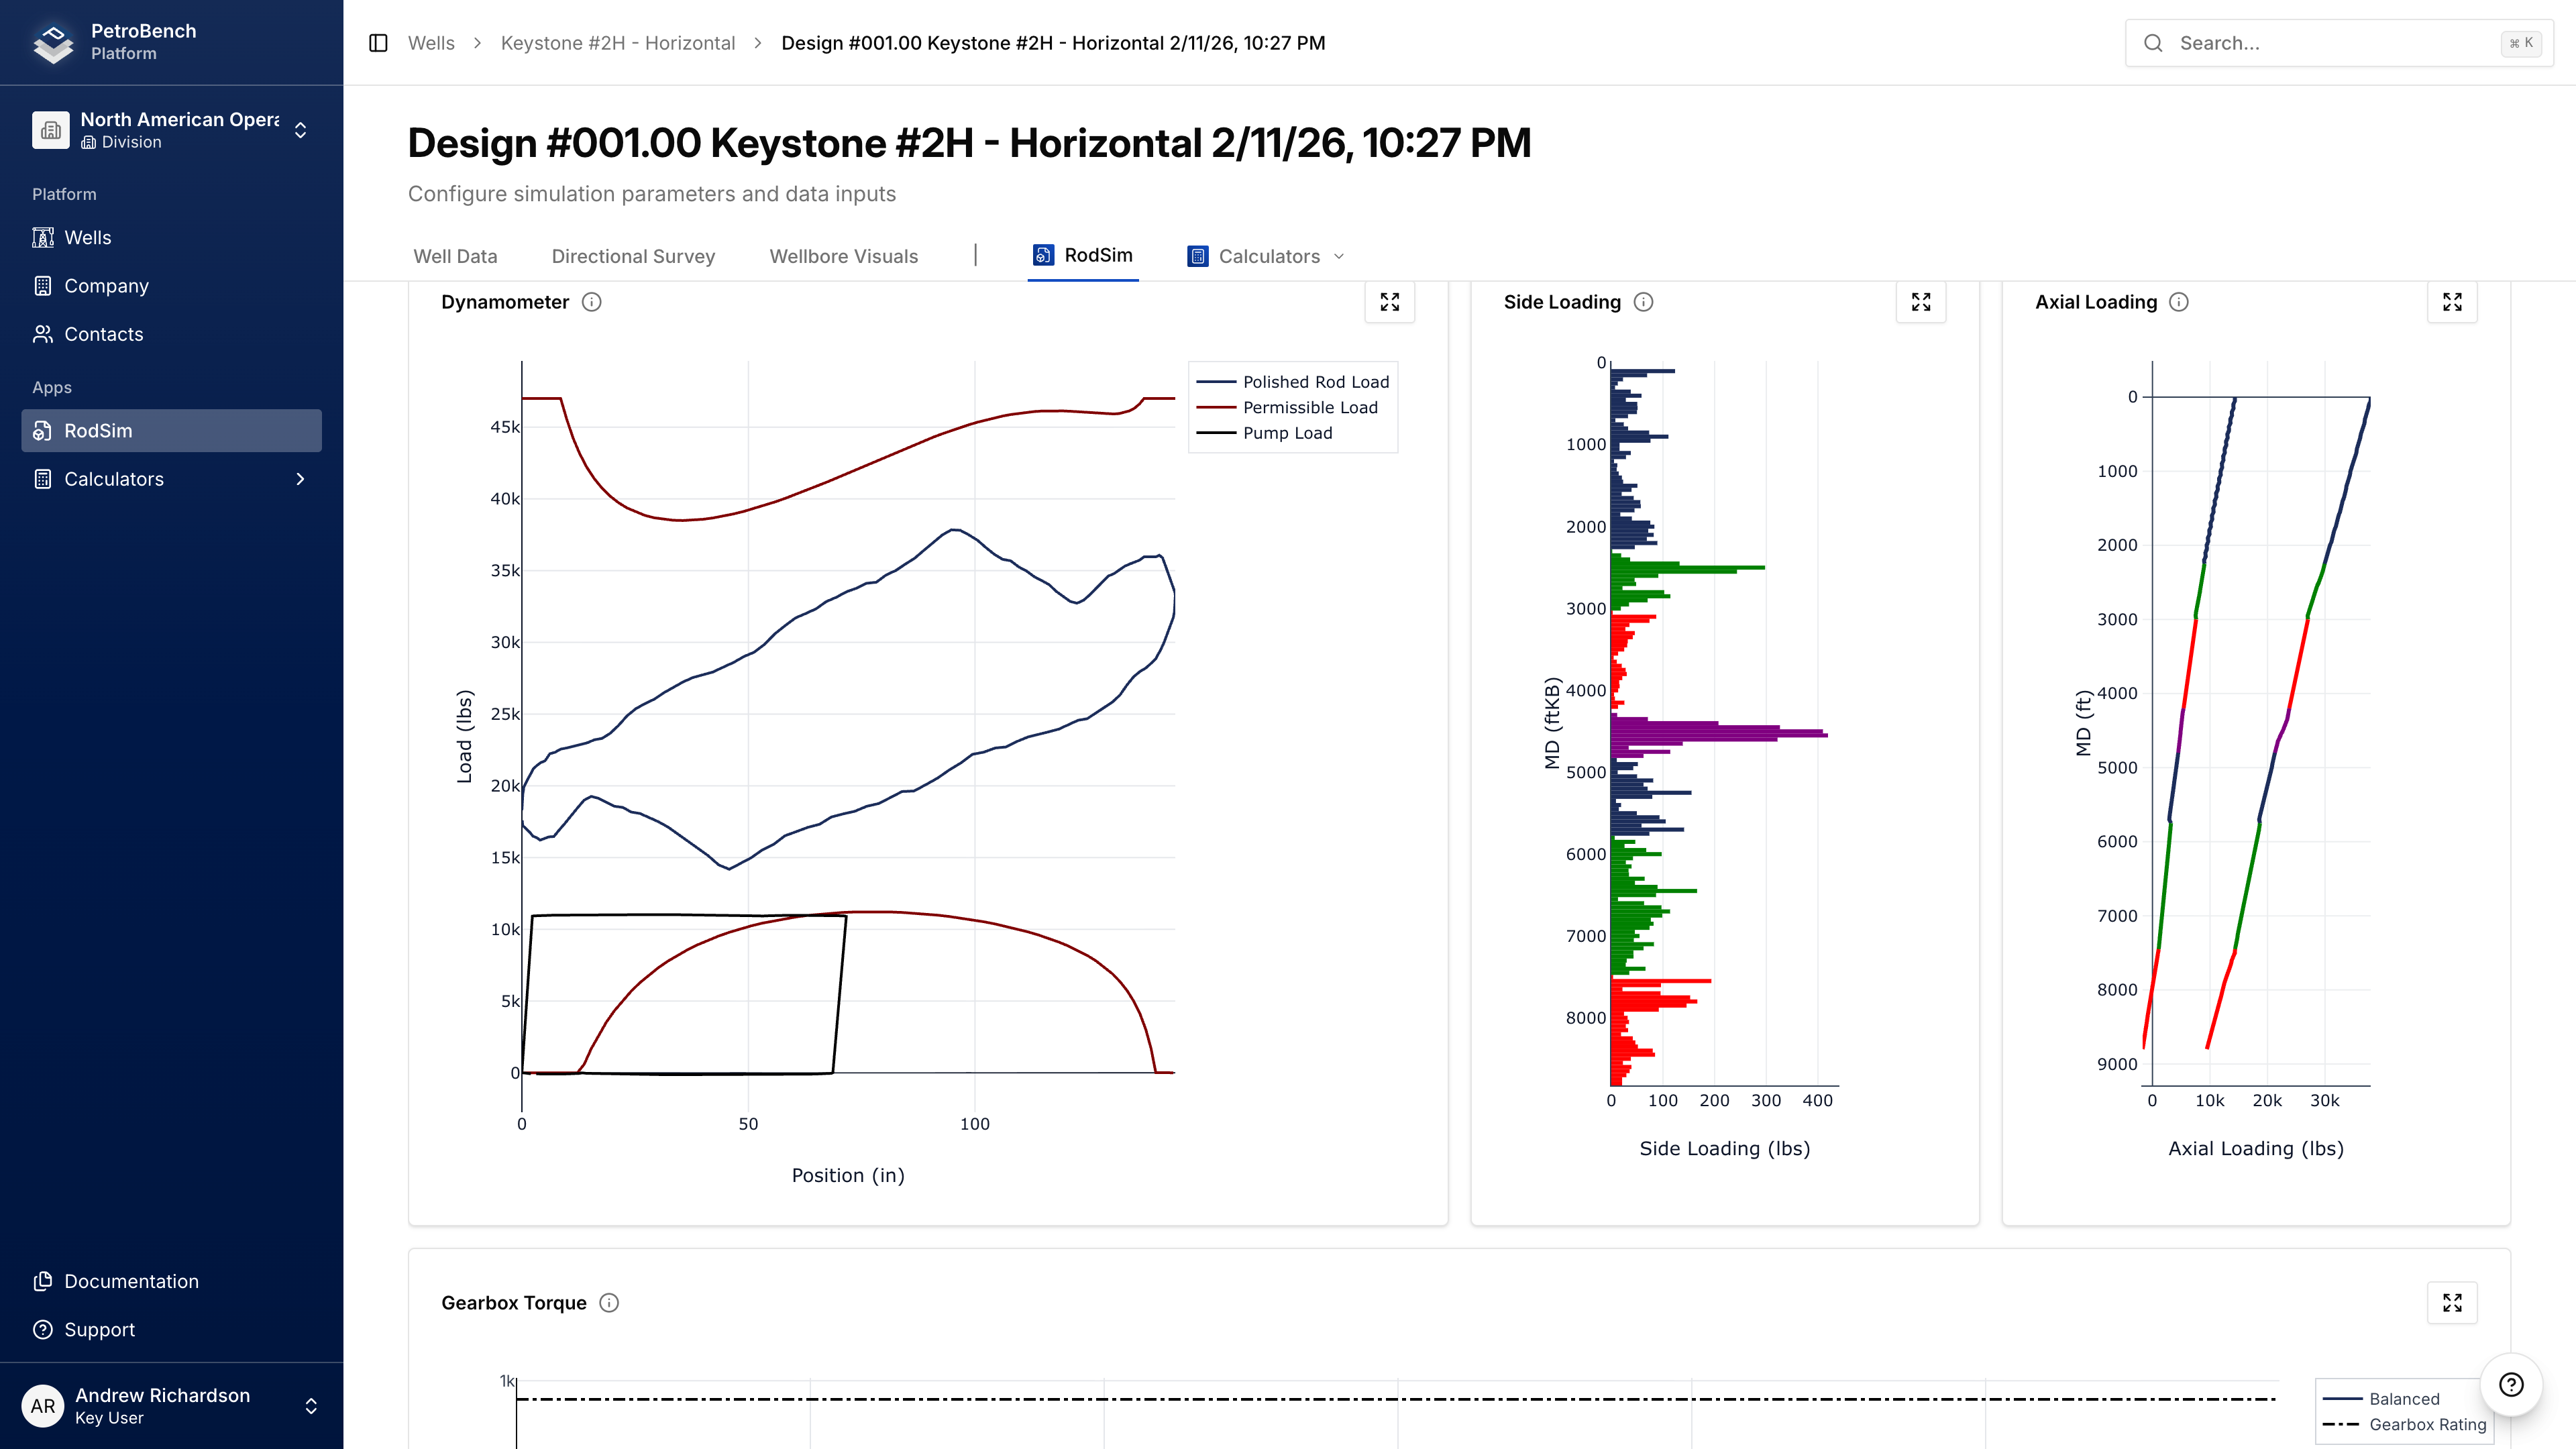
A surface dynamometer card plots polished rod load against position over one pump cycle. You know this. What matters is understanding exactly what that card contains - because it is not a picture of your pump.
The surface card is the superposition of every force acting between the polished rod and the downhole pump: rod weight, fluid load, rod stretch, coulomb friction against the tubing, viscous drag from the fluid column, inertia effects from acceleration and deceleration, and the elastic wave propagation behavior of the rod string itself.
Gibbs and Neely showed in 1966 (SPE-1165-PA) that you can work backwards from the surface card to derive the downhole pump card by solving the one-dimensional damped wave equation. Their method treats the rod string as a continuous elastic system where stress waves propagate at the speed of sound in steel – roughly 16,300 ft/s for standard carbon steel rods. The surface measurements serve as boundary conditions, and the solution at any depth gives you the load and displacement at that point.
This was the breakthrough that made modern dynacard diagnostics possible. Before Gibbs, you were staring at a surface card and guessing. After Gibbs, you could compute what the pump was actually doing.
The critical insight that still gets overlooked: the accuracy of the downhole card depends entirely on how well your wave equation solver handles the rod string model. A solver running at 50-ft fixed intervals will smooth out features that a 10-ft solver preserves. We have seen this repeatedly in PetroBench – a gas interference signature that is clearly visible at 10-ft resolution disappears entirely at 50-ft steps because the compression/expansion cycle gets averaged out across the larger intervals. The math does not lie, but the discretization can hide the truth.
Surface Cards vs. Downhole Cards: Stop Looking at the Wrong One
Here is an opinion that will bother some people: if you are making operational decisions from surface cards alone on wells deeper than about 4,000 ft, you are making mistakes you do not know about.
On a shallow well – say 2,500 ft with a simple taper – the surface card is a reasonable approximation of pump behavior. The rod string is relatively stiff, wave transit times are short, and the dynamic effects are modest. You can eyeball a surface card from a shallow well and get a reasonable read.
On a deep well, the surface card becomes increasingly misleading. In a 9,000 ft well with a 7/8-3/4-5/8 three-taper Grade D rod string running at 6 SPM on a 168-in unit, the rod stretch alone can exceed 40 inches. The wave transit time from surface to pump is roughly 0.55 seconds each way. At 6 SPM, your stroke period is 10 seconds, meaning the wave makes about 9 round trips per stroke. Every one of those reflections distorts the surface card shape.
What looks like a sharp load transition on the surface card might actually be a gradual valve event at the pump – or the reverse. A surface card that looks normal might be hiding a partial traveling valve leak that only shows up on the computed downhole card. Eickmeier documented this exact problem as early as 1966 (PETSOC-66-02-03), noting that "only a qualitative and somewhat dubious interpretation of pumping conditions can be inferred from visual inspection of the surface cards."
Sixty years later, we still see teams making decisions from surface cards on deep wells. Run the wave equation. Look at the downhole card. That is where the diagnostics live.
The Six Patterns That Actually Matter
Training courses love to show twelve or sixteen diagnostic patterns. In practice, six conditions account for the vast majority of what you will encounter in the field. Here they are in order of how often we see them across the wells running through PetroBench simulations.
Fluid Pound
This is the most common abnormal pattern in rod pump operations, and for good reason – it is the natural consequence of any well where pump displacement exceeds inflow rate, which describes most rod pump wells at some point in their life.
On the downhole card, fluid pound shows as an abrupt load drop partway through the downstroke. The plunger descends through gas or vapor until it contacts the fluid surface, at which point the load transfers sharply. The location of that load drop along the downstroke tells you the pump fillage – if it occurs at 75% of the downstroke, your pump is roughly 75% full.
The severity distinction matters for operations. Mild fluid pound - a slight inward bowing of the lower left portion of the downhole card - is often tolerated deliberately. Many operators run wells at 70-80% fillage as an intentional optimization choice, accepting mild pound to maximize total fluid lifted over 24 hours rather than running the pump intermittently at 100% fillage. The economics favor continuous pumping with some pound in many cases, particularly on wells where the restart transient is costly.
Severe fluid pound is different. When fillage drops below 50%, the impact loading as the plunger hits fluid becomes destructive. Gibbs (1982, SPE-9980-PA) documented that severe pound accelerates rod fatigue, damages pump valves, and can cause tubing buckling in the lower section. If you see the bottom of the downhole card collapsing to a narrow spike, something needs to change – either slow the pump speed, switch to intermittent pumping, or investigate why inflow dropped.
Gas Interference
Gas interference is the diagnostic pattern that causes the most confusion because it manifests differently depending on the gas-liquid ratio, pump compression ratio, and pump submergence.
The classic signature on the downhole card is a rounded, compressed shape – the card loses its rectangular form and takes on a more elliptical profile, particularly on the upstroke. What is happening: free gas in the barrel compresses during the downstroke instead of allowing the traveling valve to open promptly, and then expands during the upstroke before the standing valve opens. Both valve events are delayed, which rounds the corners of the card and reduces the effective stroke.
In the extreme case - gas lock - the gas never compresses enough to open the traveling valve, and the pump produces nothing. The downhole card collapses to a narrow sliver.
The practical diagnostic question is: how do you distinguish gas interference from a worn barrel on the surface card? Both reduce the enclosed area of the card. Both can look like reduced pump displacement. The answer is that on the downhole card, gas interference shows rounded transitions at the valve events while a worn barrel shows sloped load lines (fluid leaking past the plunger throughout the stroke). A worn barrel has a consistent area reduction regardless of pump speed; gas interference changes character when you change the pump speed because the compression ratio changes.
This is where simulation resolution matters. At 50-ft discretization in the wave equation solver, the rounded gas compression transition and the sloped worn barrel transition can look similar after the wave effects are applied. At 10-ft resolution, the phase relationship between the load transition and the position is preserved, and you can distinguish the two conditions reliably. We built PetroBench's solver at 10-ft steps specifically because of this diagnostic requirement.
Traveling Valve Leak
A leaking traveling valve allows fluid to flow from above the plunger back into the barrel during the upstroke. On the downhole card, this shows as a declining load during the upstroke – instead of a flat top (constant fluid load being carried), the load decreases from right to left as fluid leaks past the valve and reduces the net load on the rods.
The rate of load decline tells you the leak severity. A slight downward slope might represent a valve that is seating imperfectly but still producing reasonable volumes. A steep decline indicates a valve that needs replacement.
On the surface card, a traveling valve leak is often masked by the dynamic effects in deep wells. The wave reflections can create load variations on the upstroke that look similar to a valve leak. This is why the downhole card computation matters – it strips out the rod dynamics and shows you the actual valve behavior.
One diagnostic tip that is not in most textbooks: compare cards taken at different pump speeds. A mechanical valve leak (chipped seat, worn ball) will show similar load decline rates regardless of speed because the leak is driven by differential pressure, not time. A thermal or viscous seating issue will show worse performance at higher speeds because the valve has less time to seat properly. This distinction tells you whether you are looking at a workover or an operating parameter adjustment.
Standing Valve Leak
The standing valve leak is the mirror image of the traveling valve leak, but on the downstroke. Fluid leaks from the barrel back into the formation, causing the load to increase during the downstroke instead of remaining constant.
On the downhole card, this shows as a rising load along the bottom of the card from left to right. The pump never fully unloads because fluid is draining back, so the minimum load is higher than expected.
Standing valve leaks are subtler than traveling valve leaks in their operational impact because the standing valve only needs to seal during the downstroke, and the leak competes with incoming formation fluid. In wells with strong inflow, a moderate standing valve leak might not be noticed in production numbers for weeks. But it progressively reduces pump efficiency, and if the leak worsens it can eventually prevent the pump from establishing enough differential pressure to lift fluid at all.
Worn Pump Barrel (Plunger Slippage)
Barrel wear creates a clearance between the plunger and barrel that allows fluid to leak past in both directions. On the downhole card, this shows as inclined load lines on both the upstroke and downstroke – the card takes on a parallelogram shape instead of a rectangle.
The degree of inclination correlates with slippage rate. Dickinson and Jennings (1990, SPE-17313-PA) developed pattern-matching methods that could quantify the slippage from the downhole card geometry, distinguishing worn barrel from valve leaks based on the symmetry of the load line slopes.
The practical question is always: when is a worn barrel worth a workover? Fagg noted in his 1950 JPT paper (SPE-950165-G) that the dynamometer card is a record of the resultant of all forces, and isolating barrel wear from other concurrent issues requires computing the downhole card and looking at the shape, not the magnitude. A barrel that is producing at 85% volumetric efficiency with a slight parallelogram shape might run for another year. A barrel at 60% efficiency is costing you production every day it stays in the hole.
Pump-Off
Pump-off is the condition where the well has been pumped down to the point that the pump is starved for fluid. It is distinct from fluid pound in that pump-off represents a complete loss of fluid above the pump, not a partial fill.
On the downhole card, pump-off shows as the card collapsing to the lower left – the load drops to near-zero on the downstroke because there is no fluid load at all, and the upstroke load is only the rod string weight.
Most modern pump-off controllers detect this condition using polished rod load measurements and shut the well in before damage occurs. The controller algorithms typically monitor the load range (PPRL minus MPRL) and trigger shutdown when it drops below a threshold. McCoy and Podio (2000, SPE-62834-MS) described a Total Well Management approach where pump-off detection is integrated with inflow performance analysis to optimize the pumping cycle rather than simply shutting in and restarting on a timer.
The Real Skill: Reading Overlapping Conditions
Here is where experience separates from training. In the field, you rarely see a single clean diagnostic pattern. A well might have mild gas interference combined with a partial traveling valve leak and moderate fluid pound – all showing up on the same card.
Reges et al. (2015, SPE-173964-MS) addressed this directly, developing a method to analyze segments of the downhole card between valve events. Their approach classified 16 pumping conditions by examining the curvature characteristics of individual card segments rather than matching the overall shape. Critically, their method detected concurrent conditions – something that global pattern matching consistently fails at.
This is the real diagnostic skill: decomposing a messy card into its component signatures. The upstroke segment between standing valve close and traveling valve close tells you about gas compression and fluid load. The downstroke segment between traveling valve open and standing valve open tells you about fillage and valve sealing. Each segment carries specific information that is independent of (or at least separable from) the other segments.
When we built the diagnostic visualization in PetroBench, we structured it around this segmented approach rather than the traditional "match the shape to the chart" method. The wave equation gives you the downhole card at the resolution you need, and then the segment analysis lets you identify what is happening at each phase of the pump cycle independently.
Practical Workflow: From Card to Action
If you take one thing from this article, let it be this sequence:
- First, compute the downhole card. Do not diagnose from the surface card on any well deeper than 4,000 ft. The wave equation solution is not optional – it is the foundation of reliable diagnostics.
- Second, identify the valve events. The traveling valve close (upstroke load pickup), standing valve open (upstroke unloading), traveling valve open (downstroke load release), and standing valve close (downstroke load pickup) divide the card into four segments. Locate these transitions on the downhole card.
- Third, examine each segment independently. Is the upstroke load constant or declining? Is the downstroke load constant or rising? Are the valve transitions sharp or rounded? How does the effective stroke compare to the theoretical plunger stroke?
- Fourth, compare to the previous card. A single card is a snapshot. A trend is a diagnostic. A valve leak that appeared last week and is getting 2% worse per day tells you something different than a valve leak that has been stable for six months.
The difference between a good rod pump engineer and an average one is not pattern recognition. It is the discipline to follow the process, compute the downhole card, and look at the segments before jumping to a conclusion. The patterns matter, but only after you have done the math.
References
- Fagg, L.W. 1950. "Dynamometer Charts and Well Weighing." J Pet Technol 2(06): 165–174. SPE-950165-G.
- Gibbs, S.G. 1963. "Predicting the Behavior of Sucker-Rod Pumping Systems." J Pet Technol 15(7): 769–778. SPE-588-PA.
- Gibbs, S.G. and Neely, A.B. 1966. "Computer Diagnosis of Down-Hole Conditions In Sucker Rod Pumping Wells." J Pet Technol 18(1): 91–98. SPE-1165-PA.
- Eickmeier, J.R. 1966. "Applications of the Delta II Dynamometer Technique." J Can Pet Technol 5(02): 66–74. PETSOC-66-02-03.
- Gibbs, S.G. 1982. "A Review of Methods for Design and Analysis of Rod Pumping Installations." J Pet Technol 34(12): 2931–2940. SPE-9980-PA.
- Doty, D.R. and Schmidt, Z. 1983. "An Improved Model for Sucker Rod Pumping." SPE Journal 23(1): 33–41. SPE-10249-PA.
- Dickinson, R.R. and Jennings, J.W. 1990. "Use of Pattern-Recognition Techniques in Analyzing Downhole Dynamometer Cards." SPE Prod Eng 5(02): 187–192. SPE-17313-PA.
- McCoy, J.N. and Podio, A.L. 2000. "Modern Total Well Management." SPE-62834-MS.
- Reges, G.D. et al. 2015. "A New Approach To Diagnosis of Sucker Rod Pump Systems by Analyzing Segments of Downhole Dynamometer Cards." SPE-173964-MS.
- Sharaf, S.A. et al. 2019. "Beam-Pump Dynamometer Card Classification Using Machine Learning." SPE-194949.