Every rod pump well has more than one reasonable design. You might be weighing a two-taper string against a three-taper string, comparing Grade D rods to Grade K, or testing whether bumping stroke speed from 6 SPM to 8 SPM is worth the extra stress. The question is never whether alternatives exist - it's which alternative performs best for your specific well conditions.
PetroBench's comparison feature lets you place up to five rod string designs side by side and evaluate them on loads, stresses, displacement, and pump card shape - all in one view.
Set Up Your Baseline Design
Start with the design you already know - or the one closest to what's currently running in the field. Open PetroBench and create a new simulation with your well parameters:
Enter your well depth, tubing size, fluid properties, and pump specifications. For the rod string, define your taper sections - for example, a 7/8-inch top section at 3,200 ft and a 3/4-inch bottom section at 2,800 ft using Grade D rods. Set your operating parameters: stroke length, pumping speed, and surface conditions.
Run the simulation. Review the results to confirm everything looks reasonable - peak polished rod load, minimum rod load, pump displacement, and the surface dynamometer card shape. This is your baseline. Give it a clear name like "7/8-3/4 Grade D - 6 SPM" so you can identify it easily later.
Create a Variant
You have two options here. You can duplicate your baseline design and modify specific parameters, or you can create an entirely new design from scratch. Duplicating is faster when you only want to change one or two variables - it keeps everything else identical, which makes the comparison cleaner.
For example, if you want to test a heavier top section, duplicate the baseline and change the top taper from 7/8-inch to 1-inch rods. Or swap the rod grade from D to K. Or increase the pumping speed from 6 SPM to 8 SPM. Change only one variable at a time if you want to isolate its effect.
Name the variant clearly - something like "1-7/8-3/4 Grade D - 6 SPM" so the difference from the baseline is obvious at a glance.
Open the Comparison View
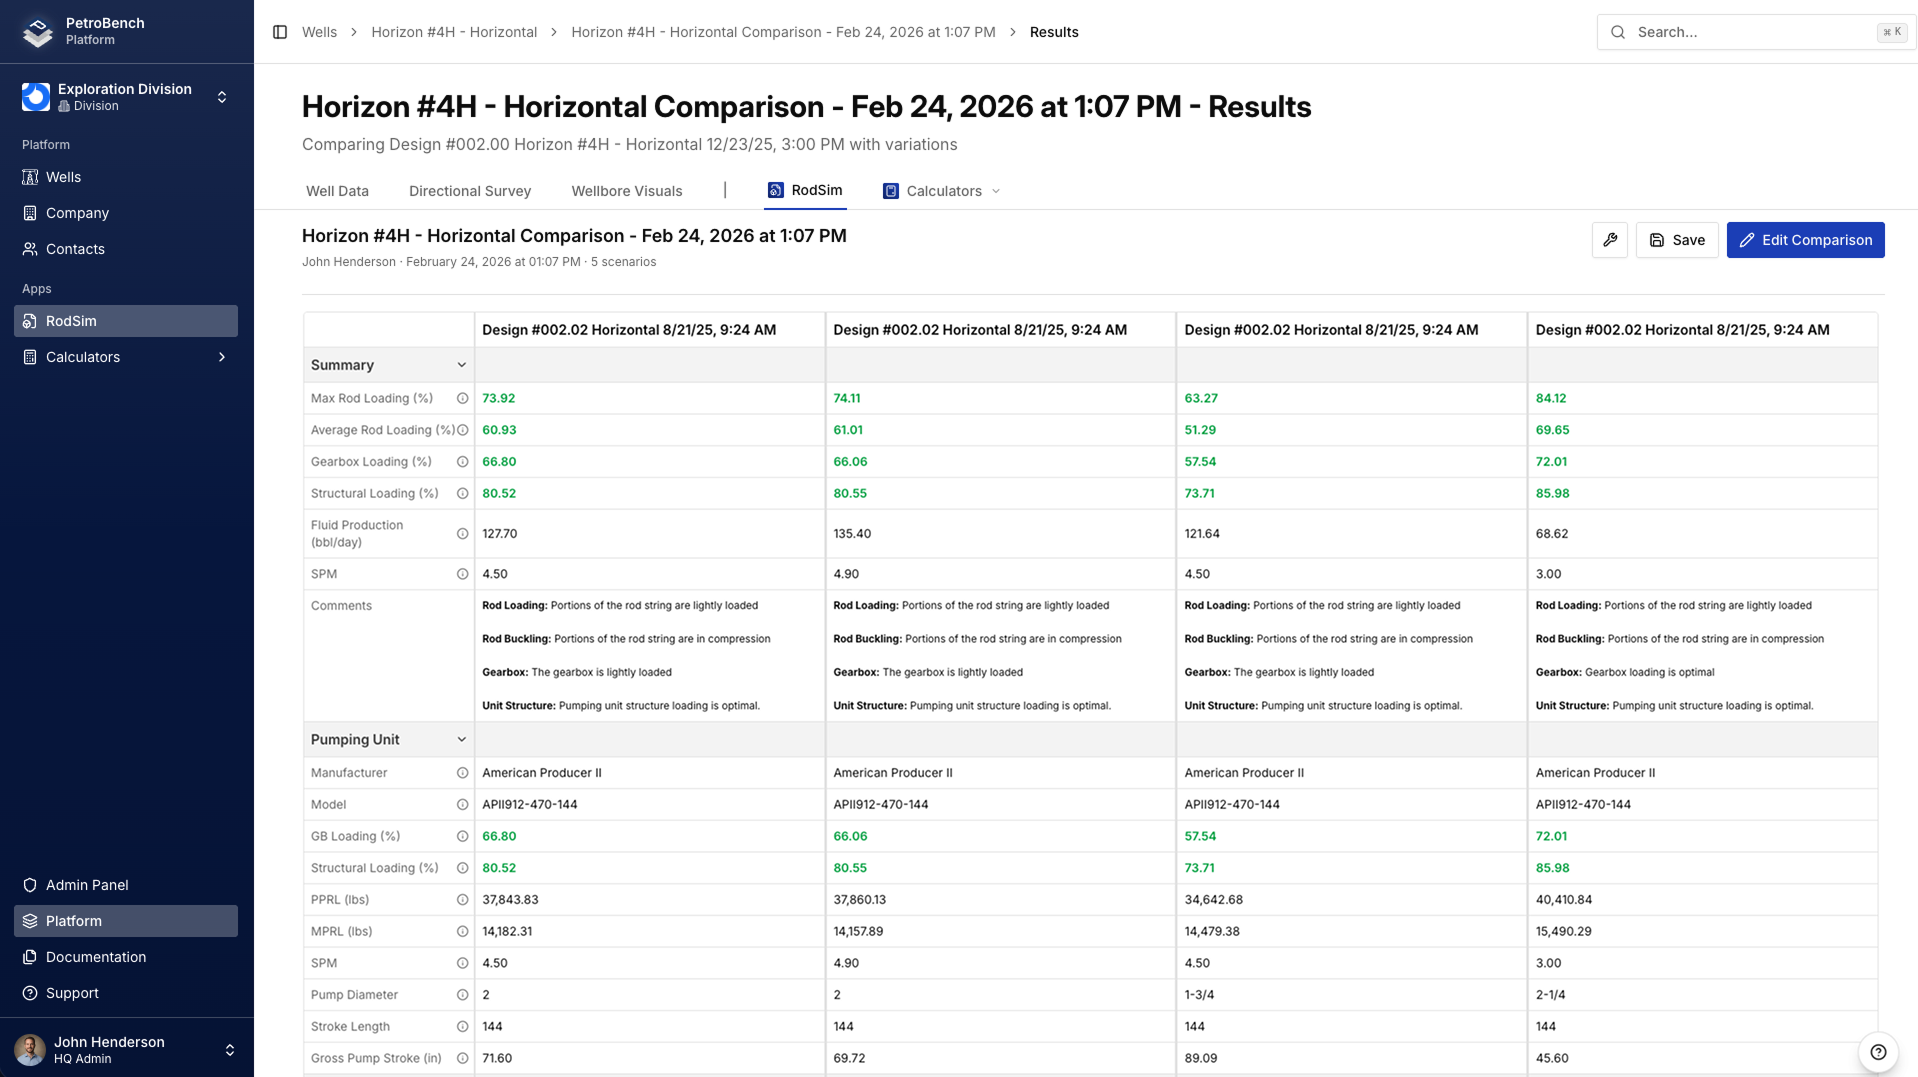
With at least two completed simulations, you can launch the comparison view. Select your baseline design and your variant from the simulation list - check the boxes next to each one. Click the Compare button that appears in the toolbar.
PetroBench opens a split-screen layout with your designs arranged side by side. Each design gets its own column, and corresponding data panels align horizontally so you can scan across and spot differences immediately.
Read the Comparison Panels
The comparison view organizes results into several panels. Here's what each one shows and what to look for:
Loads panel - Displays peak polished rod load (PPRL), minimum polished rod load (MPRL), and rod weight for each design. A heavier top taper increases PPRL but may reduce stress at the taper transition. Check that PPRL stays within your pumping unit's structural capacity.
Stresses panel - Shows maximum and minimum stress at each taper section, along with the Goodman diagram position. This is where you see whether a design has adequate fatigue life or is running too close to the allowable stress limit. Compare the stress ratio (actual vs. allowable) across designs.
Displacement panel - Reports pump displacement, net plunger stroke, and rod stretch. More rigid rod strings (larger diameters or higher-grade materials) lose less stroke to elastic deformation, resulting in higher pump displacement at the same surface stroke length.
Pump card panel - Overlays the downhole pump cards for each design. Look for differences in card area (proportional to fluid production), valve action timing, and any signs of gas interference or pump-off. A fuller card means better pump fillage.
Compare Up to Five Designs
Two designs are a good start, but real optimization often requires testing more options. You can add up to five designs into the comparison view. Go back to your simulation list, select additional designs, and add them to the comparison.
This is especially useful when you are exploring a range - say, testing 6, 7, and 8 SPM across two different taper configurations. With five columns, you can see the full picture without switching back and forth between individual results.
Practical Examples
Comparing 7/8-3/4 vs 1-7/8-3/4 Taper
This is one of the most common comparisons in rod pump design. The heavier 1-inch top section adds weight but reduces stress at the top of the string. In the comparison view, you will typically see higher PPRL with the 1-inch taper but a more favorable Goodman position - meaning longer fatigue life. The trade-off is a higher load on your pumping unit. If your unit has capacity to spare, the heavier taper often wins on reliability.
Comparing Grade D vs Grade K Rods
Grade K rods have a higher allowable stress than Grade D, which means the Goodman diagram shows more headroom for the same loading conditions. In the comparison view, the loads panel will be nearly identical between the two (same rod sizes mean same weight), but the stresses panel will show a much better stress ratio for Grade K. The decision comes down to cost - Grade K rods cost more upfront but can justify themselves in wells with high failure rates or aggressive operating conditions.
Comparing 6 SPM vs 8 SPM
Increasing pumping speed boosts displacement but also increases dynamic loads and stress. In the comparison view, watch the loads panel closely - PPRL rises with speed, and the pump card may show signs of incomplete fillage at higher speeds if the well cannot deliver enough fluid. Compare the displacement panel to see whether the theoretical production gain is worth the added mechanical risk. If the Goodman position tightens significantly at 8 SPM, you might settle on 7 SPM as a compromise.
Making the Decision
With your designs laid out side by side, focus on these key factors:
Peak stress vs. Goodman limit - The most critical safety check. Any design where peak stress exceeds about 80% of the Goodman allowable should be treated with caution. Lower is better for rod life.
Energy consumption - Heavier rod strings and faster pumping speeds consume more energy. If two designs produce similar displacement, the one with lower peak load and lower energy use is the better choice for long-term operating cost.
Pump fillage - Check the pump card overlay. A design that produces a fuller, more rectangular pump card at lower stress is almost always the winner. Incomplete fillage means you are pushing hardware harder than necessary for the fluid the well can deliver.
There's rarely a single "best" design. Instead, the comparison view helps you see the trade-offs clearly and pick the design that balances production, reliability, and cost for your specific situation.
Saving and Sharing Results
Once you have identified your preferred design, you can save the comparison for future reference. PetroBench lets you export the comparison as a report that includes all the parameter inputs and result summaries for each design. This is useful for internal reviews, regulatory documentation, or handing off the analysis to a colleague.
You can also share a comparison link directly with your team. Anyone with access to the project can open the same side-by-side view, review the data, and add their own notes. This keeps the decision-making process transparent and documented - no more spreadsheets emailed back and forth.
The comparison feature turns what used to be a tedious manual process into a quick, visual workflow. Instead of flipping between tabs and copying numbers into a spreadsheet, you get a clear picture of how your designs stack up - right where you do the engineering work.