Not every survey arrives as a neat digital file. Sometimes you're working from a paper report, a PDF scan, or a quick phone call with the directional driller. PetroBench handles all of these cases. You can key in your deviation survey data directly and get a full 3D wellbore path in seconds.
This guide walks you through every step, from opening the survey tab to verifying your results in the 3D viewer.
Navigate to the Directional Survey tab
Open any well in PetroBench and select the Directional Survey tab in the well detail view. You'll see three main areas:
- Survey table: your raw station data in tabular form
- 3D wellbore viewer: an interactive visualization of the calculated well path
- Import button: for uploading CSV or Excel files (covered separately)
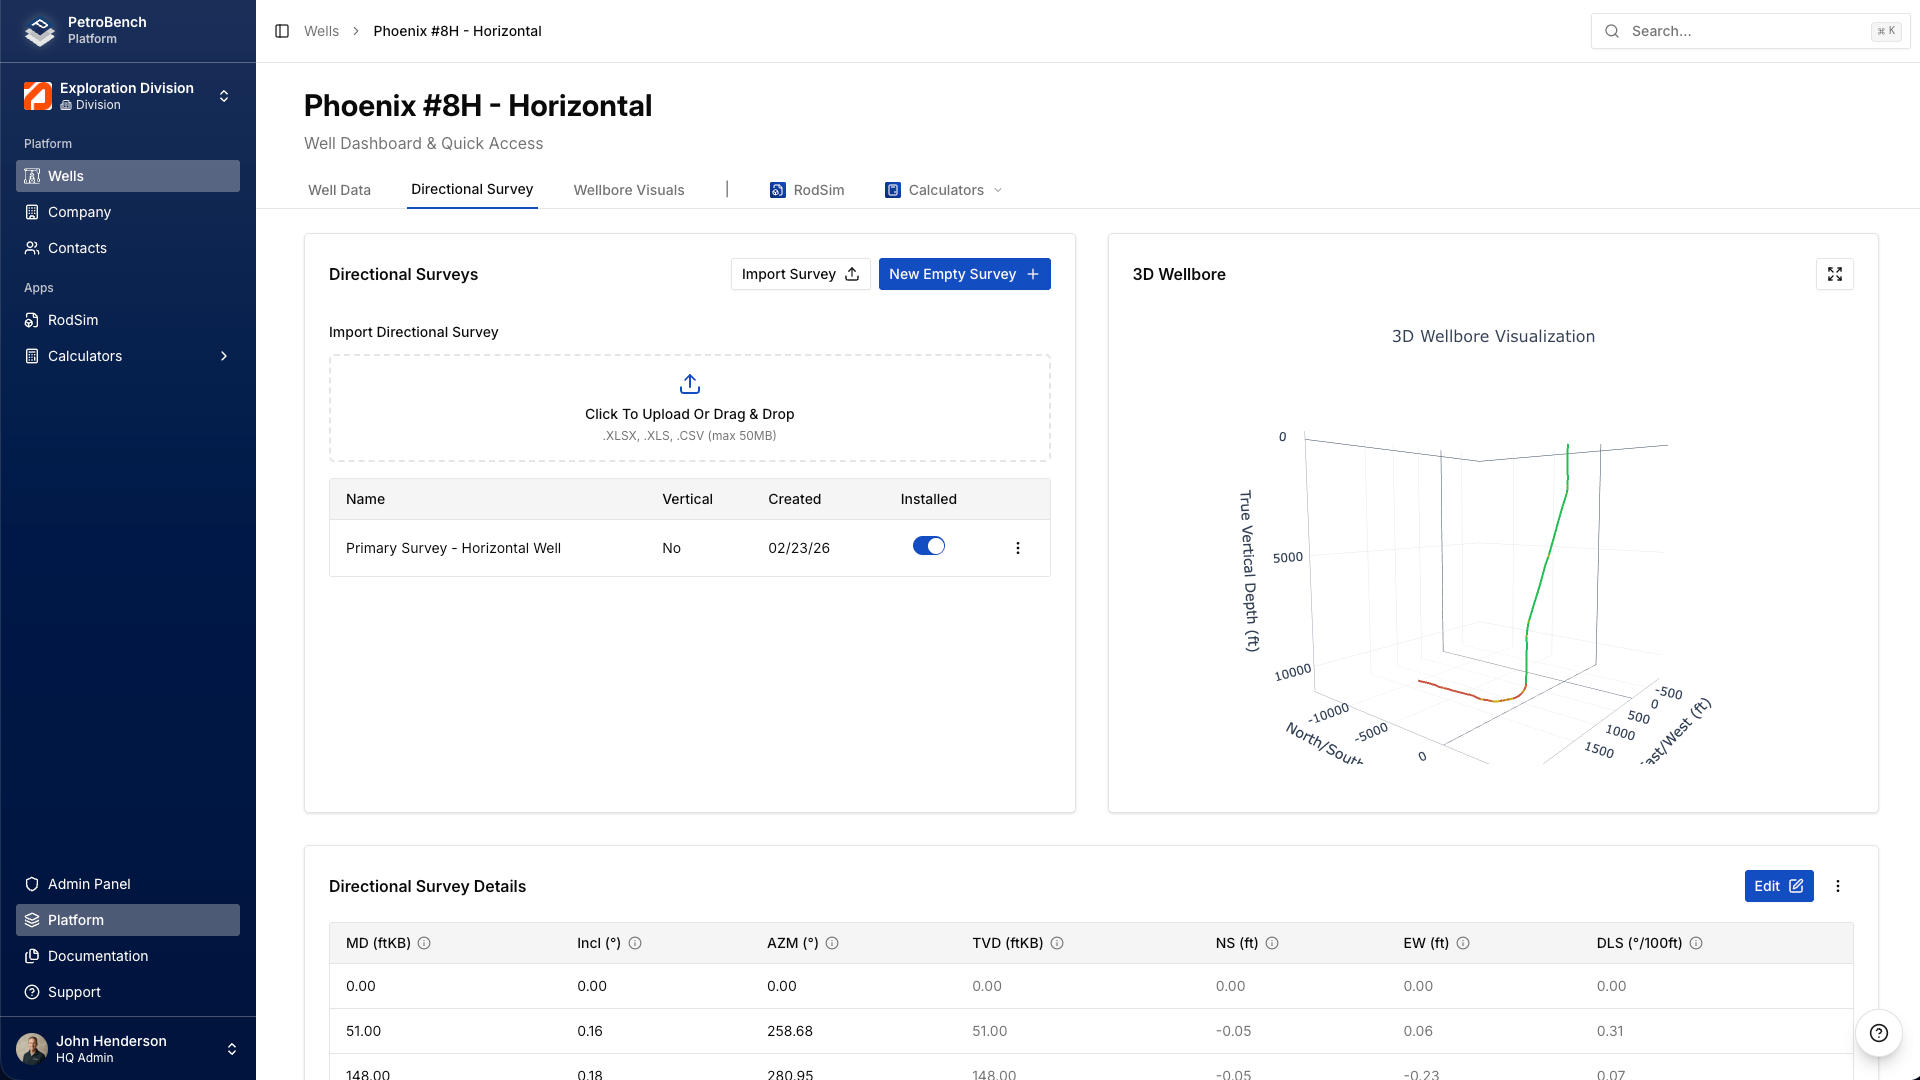
Create a new survey
If the well doesn't have a survey yet, click the empty table area to start entering rows. Each row represents one survey station, which is a single point where the measurement tool recorded depth, inclination, and azimuth.
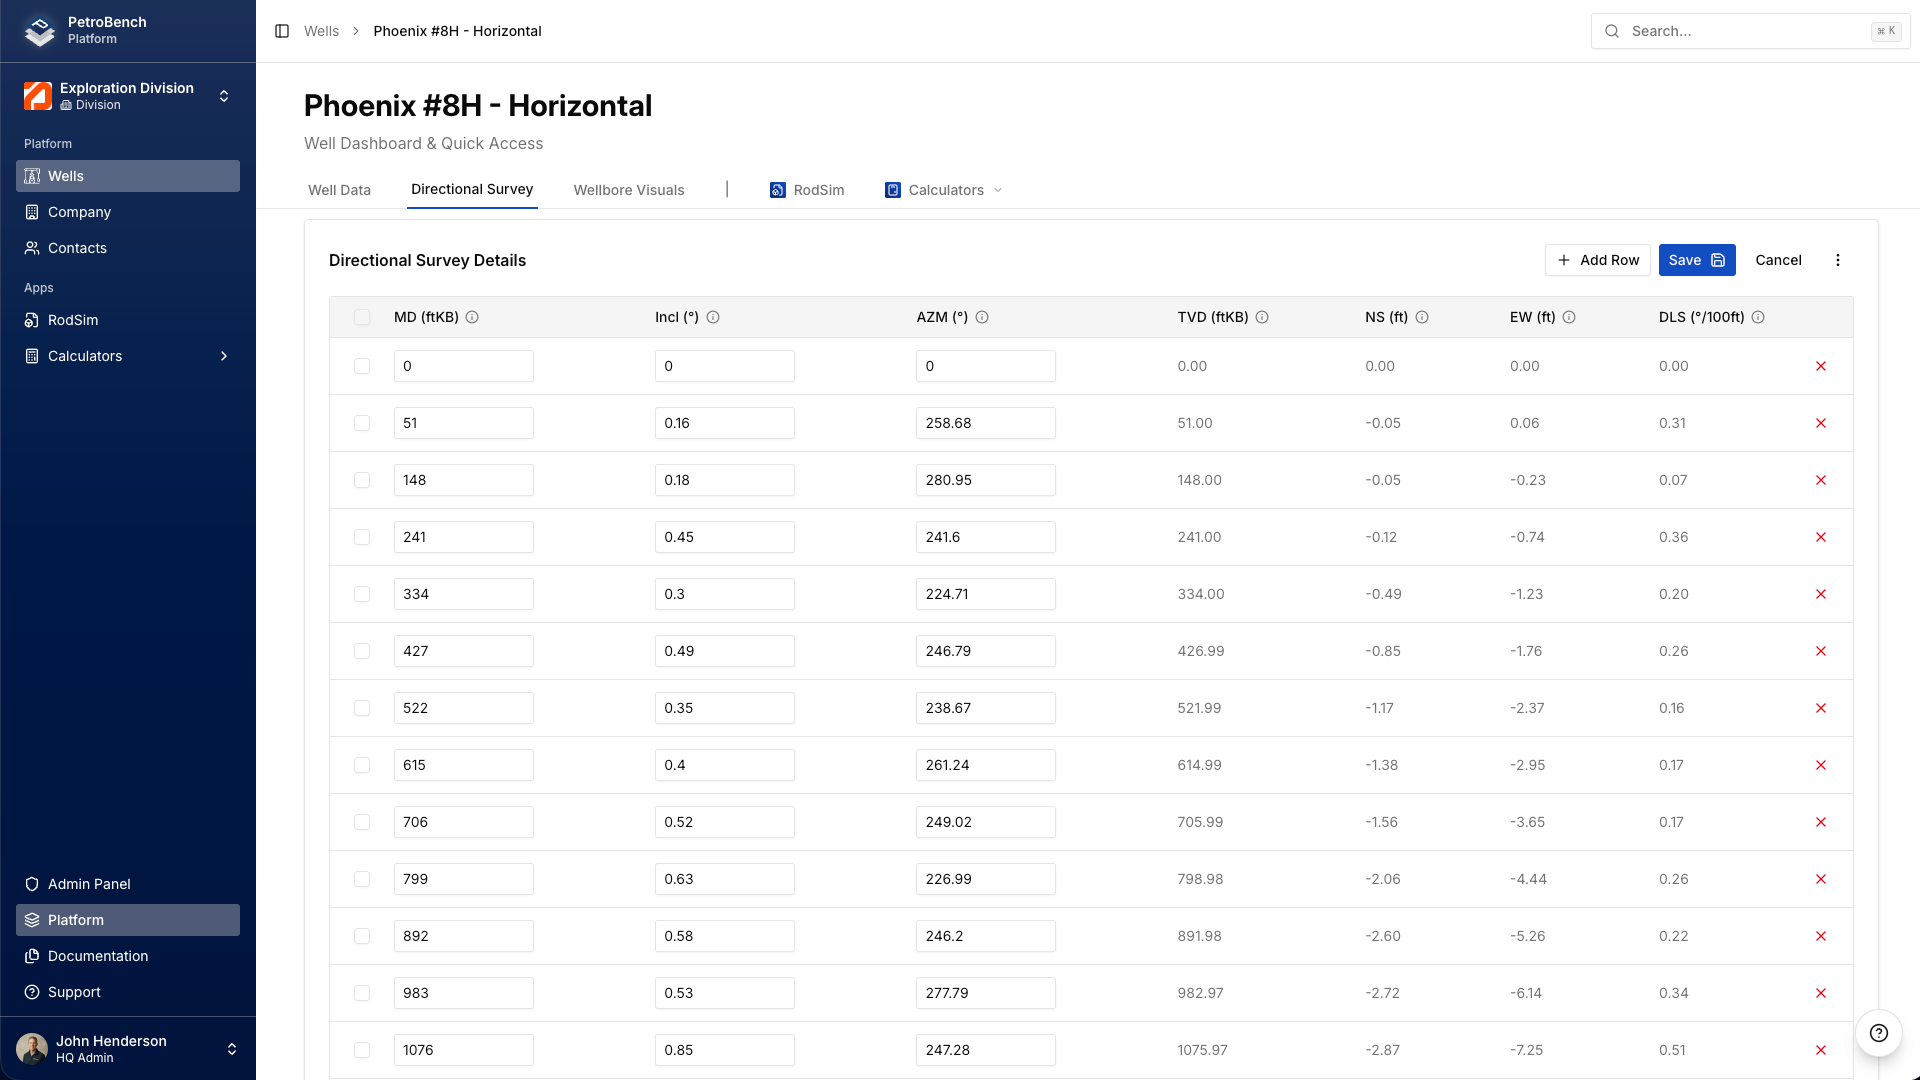
Required columns: MD, Inclination, Azimuth
Every deviation survey needs three values per station:
- MD (Measured Depth): the distance along the wellbore from surface, in feet or meters
- Inclination: the angle from vertical, in degrees (0 = straight down, 90 = horizontal)
- Azimuth: the compass direction the wellbore is heading, in degrees (0 = North, 90 = East)
Type each value into the corresponding column. Press Tab to move between cells, or Enter to move to the next row.
Always start with the surface station
Your first row must be the surface station: MD = 0, Inclination = 0, Azimuth = 0. This tells PetroBench where the wellbore begins. Without it, the minimum curvature calculation has no starting reference and your computed coordinates will be wrong.
If your paper report skips the surface station (some do), add it yourself. It's always 0, 0, 0.
How PetroBench calculates the well path
Once you enter your MD, Inclination, and Azimuth values, PetroBench automatically computes four additional columns using the minimum curvature method:
- TVD (True Vertical Depth): the vertical distance from surface to the station
- NS (North/South displacement): how far north or south the station is from the surface location
- EW (East/West displacement): how far east or west the station is from the surface location
- DLS (Dogleg Severity): the rate of change in wellbore direction, expressed in degrees per 100 feet (or 30 meters). Higher values mean sharper turns.
You don't need to enter these values. PetroBench derives them in real time as you type. If a computed value looks off, double-check the raw station above it.
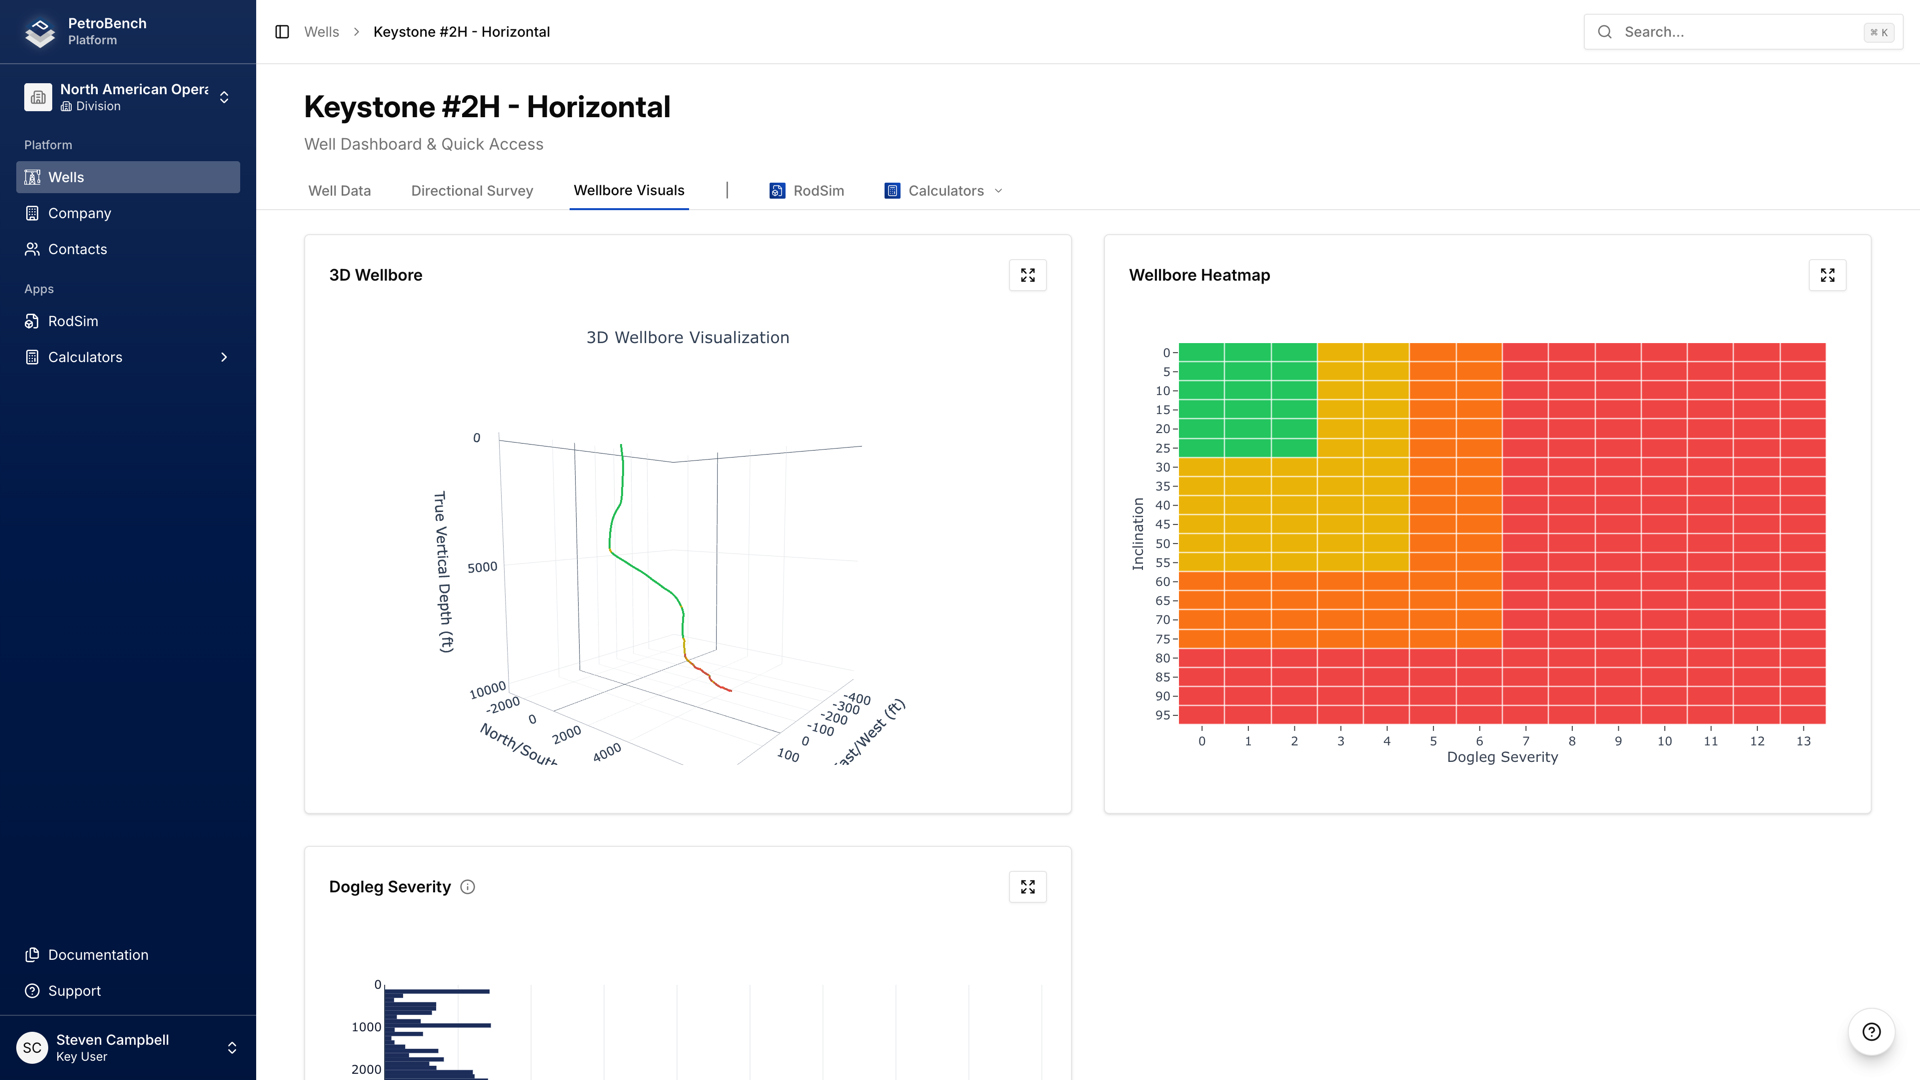
Verify with the 3D wellbore viewer
After entering your data, check the 3D wellbore visualization on the right side of the screen. It renders your well path in three dimensions with a color-coded heatmap for dogleg severity.
Rotate the view by clicking and dragging. Zoom with your scroll wheel. Look for:
- Smooth curves: the path should look continuous, not jagged
- Expected direction: confirm the well heads in the right compass direction
- Reasonable DLS: high dogleg severity (red on the heatmap) at unexpected depths usually means a data entry error
Common data entry mistakes
These are the errors we see most often when engineers enter surveys by hand:
- Missing surface station. Without the 0, 0, 0 row at the top, every computed coordinate shifts. Always add it first.
- Inconsistent MD intervals. If your stations jump from 500 ft to 5,000 ft with nothing in between, the minimum curvature calculation interpolates a straight line through that gap. Add intermediate stations where available.
- Wrong units. Make sure your MD values match the unit system set on the well (feet or meters). Mixing units produces wildly incorrect TVD and displacement values.
- Swapped inclination and azimuth. Easy to do when reading from a dense report. If the 3D path looks completely wrong, check whether these two columns are transposed.
- Decreasing MD values. Measured depth must always increase from one station to the next. If you accidentally enter a smaller MD on a later row, the calculation breaks down.
When to use import vs. manual entry
Manual entry works best for:
- Short surveys with fewer than 20 stations
- Quick corrections to a few specific stations
- Data sourced from paper reports or verbal communication
Use the CSV or Excel import when you have a digital file with dozens or hundreds of stations. The import tool maps columns automatically and handles large datasets in a single step.
Either way, PetroBench runs the same minimum curvature calculation and renders the same 3D view. The only difference is how the data gets into the table.