


पूरा chart देखने के लिए क्लिक
Rod Stress और Loading
stroke rate से समूहित PIP और pump fill vs bottom-minimum stress और max rod loading। string safe band कहाँ छोड़ती है, देखें।


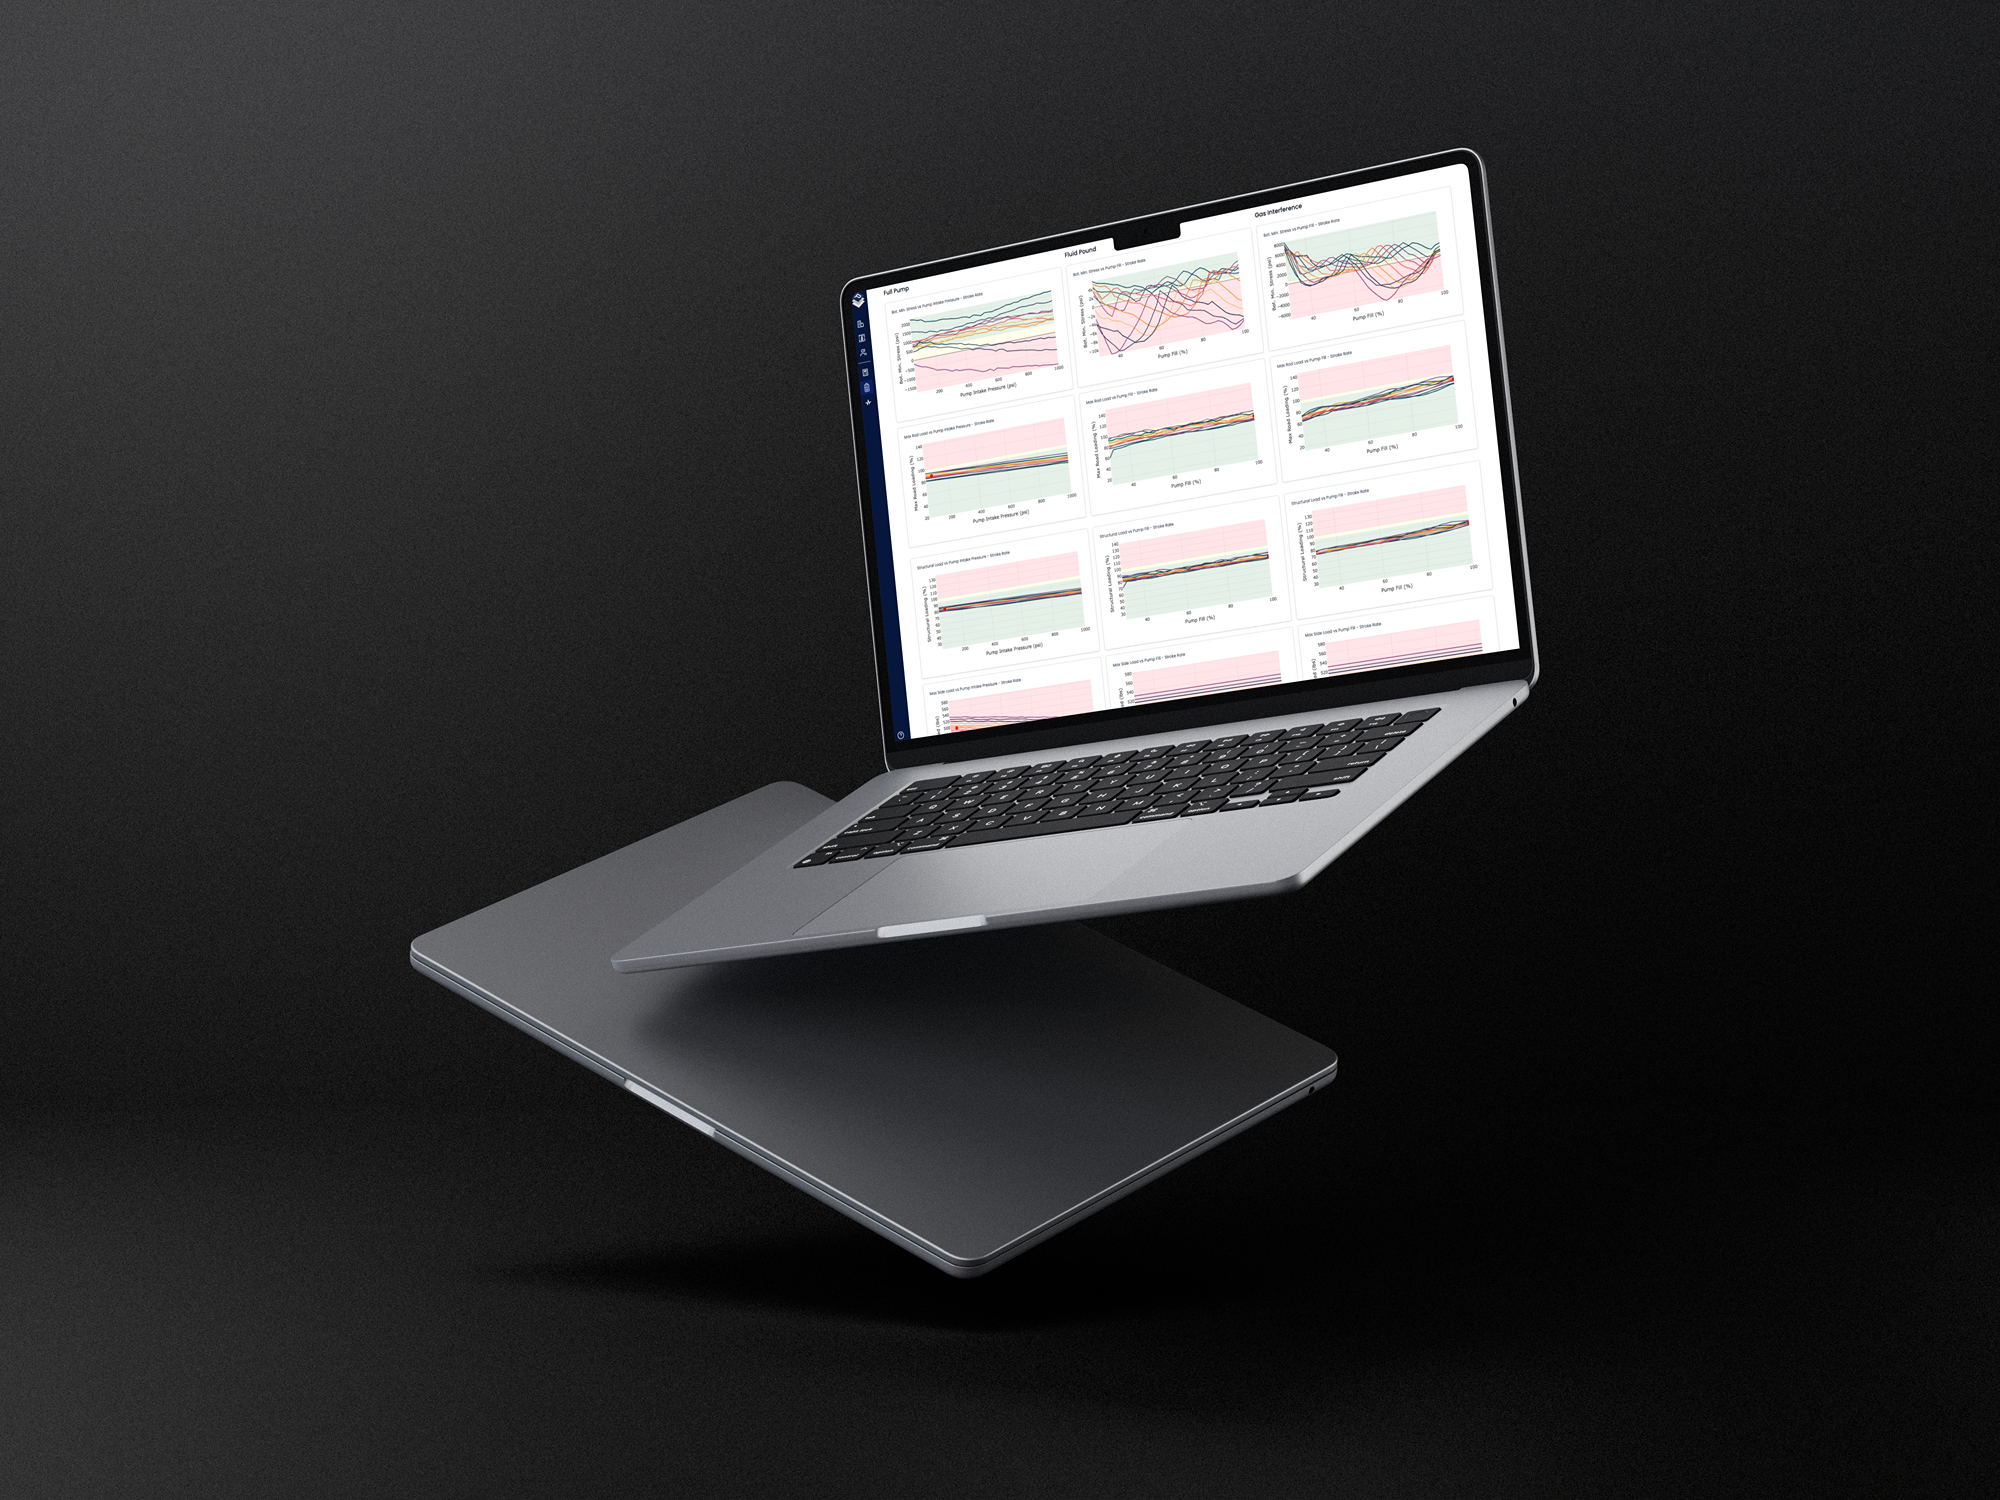
RodSim Dynamics pump fillage, pump intake pressure और stroke rate पर समानांतर संवेदनशीलता sweep चलाता है। कुआँ बदलने पर string और unit कैसे टिकते हैं, देखें।
Dynamic Output pump fillage, pump intake pressure और stroke rate पर rod stress, unit loading और production समूहित करता है। matrix देखें, फिर कोई chart expand करें।
एक समानांतर sweep से rod, pumping unit और performance अनुभाग।
pump fillage, PIP और SPM पर stress, loading और production curves।
आपका stroke rate हर expanded chart पर highlighted रहता है।
Chart frame भरते हैं। zoom या expanded stress chart खोलने के लिए क्लिक करें।
Dynamics PetroBench में मौजूद कुएँ पर तीनों अक्ष समानांतर चलाता है। rod और pumping unit sweep पर सीमाओं में रहते हैं या नहीं, design snapshot पर ही नहीं, देखें।

stroke rate से समूहित pump intake pressure और fill vs rod stress और max rod loading।
प्रत्येक stroke rate के लिए fillage और PIP के विरुद्ध stress और structural loading plot। string छेद में जाने से पहले overload दिखता है।
pump fillage, pump intake pressure और SPM एक run में साथ चलते हैं। operations जो चलाएगी operating window देखें।
chart पर सीमाओं में रहने वाला डिज़ाइन चुनें, फिर कुएँ पर अनुशंसित डिज़ाइन सेट करें।
प्रत्येक अक्ष live कुएँ पर engineer बदलने वाला lever है। Dynamics उन्हें साथ चलाता है ताकि one-off cases नहीं, interaction दिखें।


एक समानांतर sweep तीन review layer feed करता है। प्रत्येक अनुभाग rod, pumping unit और production sign-off graph समूहित करता है।
पूरा chart देखने के लिए क्लिक
stroke rate से समूहित PIP और pump fill vs bottom-minimum stress और max rod loading। string safe band कहाँ छोड़ती है, देखें।
पूरा chart देखने के लिए क्लिक
उसी matrix पर gearbox और structural loading। pump fillage और speed बदलने पर unit rating में रहे, design snapshot पर ही नहीं।
पूरा chart देखने के लिए क्लिक
sweep vs fluid production और system efficiency। rod और unit सीमाएँ rate से जोड़ें ताकि रखा डिज़ाइन window पर produce करे।
ज्ञात कुआँ लाएँ। sensitivity matrix चलाएँ और graph से base case चुनें।
हमारी शेड्यूलिंग प्रणाली अस्थायी रूप से अनुपलब्ध है। सीधे शेड्यूल करने के लिए नीचे क्लिक करें या हमसे संपर्क करें।
क्या आपके कोई प्रश्न हैं या किसी और चीज़ में मदद चाहिए? संपर्क करें